(See handouts nos.14 & 15; readings Ohno, McKinnon-Schnabl)
One of the arguments raised after the Asian crisis of 1997-1998 was that the pre-crisis exchange rate management in developing East Asia was flawed. The standard view says that:
--East Asian currencies were overvalued before the crisis.
--Their dollar peg was too rigid.
--The Japanese yen depreciation around 1996 caused relative appreciation of their currencies and contributed to the 1997 crisis.
--The large Chinese RMB depreciation in January 1994 also adversely affected the competitiveness of the ASEAN countries.
This view is still influential today. According to its proponents, the following policies are suggested for East Asia:
--Do not peg to the dollar again.
--Instead, adopt a currency basket of dollar, yen and euro with appropriate weights.
However, I happen to have a different opinion on the East Asian currencies, and that is the topic of this lecture.
Actually, many East Asian countries returned to (or continued) the dollar-based exchange rate management after the Asian crisis. A few years ago, there was a closed session among Japanese MOF officials and economists, where this issue was brought up. Some economists said that the developing countries in East Asia did not learn any lesson from the Asian crisis; they were so stupid to go back to the dollar peg. But I said, "maybe the stupidity is on the side of the economists. I think the dollar-based currency management is appropriate for many reasons, and these countries were right to go back to the dollar."
At present, some economists and officials around the Japanese MOF are eager to promote the currency basket idea in East Asia. But the support is not unanimous.
Before we go any further, let us understand the concept and calculation method of the real effective exchange rate. REER is the most basic indicator of a country's international price competitiveness.
"Real" means inflation-adjusted. The effects of currency depreciation may be offset by domestic inflation. If the currency depreciates 10% and the domestic price level becomes 10% higher than the rest of the world, there is no change in competitiveness. The "real" exchange rate adjusts for this. This is done by multiplying the nominal exchange rate by an appropriate index of relative inflation between home and abroad. The important question is: which price index should be used (CPI, WPI, GDP deflator, unit labor cost (ULC), etc)?
"Effective" here means trade-weighted. A country has many trading partners, so we need to calculate the average competitiveness against a group of countries--USA, China, Japan, Korea, Indonesia, ... Typically, the country weights are constructed in proportion to total bilateral trade (exports + imports). But sometimes, only exports, manufactured goods trade, or trade with industrial countries may be used, depending on the purpose of calculation.
So, the real effective exchange rate means the "inflation-adjusted, trade-weighted exchange rate."
The IMF's International Financial Statistics (IFS) reports CPI-based REERs for many countries and WPI-based REERs for a smaller number of countries. It also shows ULC-based REERs for industrial economies. IMF's country reports usually contain REER diagrams. The New York Federal Reserve Bank, J P Morgan, and many other public and private institutions also calculate REERs. And the central bank of your country should also be regularly calculating REER.
But you must remember, there are many ways to calculate REERs with alternative trade weights, price indices, and base periods. This means it is possible to show more or less overvaluation depending on these choices.
If you want to calculate your own REER for your country, you can do so with a spread sheet (for example, EXCEL). The calculation formula is relatively simple, but data collection is usually difficult. You must gather good and comparable price and exchange rate data for all major trading partners (some of the countries may have very weak statistical databases). Consistent price data is particularly difficult to collect.
DO IT YOURSELF RECIPE: how to compute REER using EXCEL
Sample sheet (Vietnam's REER calculation 1989-2003, 493KB)
(1) Determine the purpose: before you get started, think hard about the purpose of calculation. Do you want to calculate the competitiveness of domestic manufacturing industries, or all industries (including agriculture and mining)? Do you want to use bilateral weights, or global weights (to include the competition in third markets)? All this will affect your choice of price index and trade weights.(2) Construct trade weights: if you are using total bilateral trade as weights, get the bilateral export and import data for your country (how much your country trades with Japan, China, Korea, etc). If the central statistical office of your country does not have good data, you may want to use UN or IMF data. Get the most recent data, or an average of recent years. Rank trading partners by the amount of trade and ignore those with tiny amounts of trade (de minima rule). Also, it is a good idea to exclude a country with hyperinflation (it tends to screw up your calculation). After removing small trading partners, you should be able to cover about 80-90% of total trade. Re-adjust weights proportionately so that they add up exactly to 1.
(3) Collect exchange rate and price data: from IFS, commercial database, or national statistics, collect necessary data for home and selected trading partners. Monthly data is preferable. Place data neatly in the Excel sheet. Exclude countries with lots of missing data, apparent gaps or other irregularities (then you must recalculate trade weights). It often happens that some countries do not report the most recent months. Extrapolate to fill the gap. Data collection with necessary adjustments is the most difficult step in the calculation.
(4) Use the formula to calculate REER: first, calculate the real exchange rate of your country against each trading partner. Second, sum them up using trade weights. It is better to work with "levels" rather than "rates of change." If you want the rate of change in REER, calculate it as the final step after you have the REER level index (the formula is given in handout no.14; also see the attached sample sheet).
Please be careful. There are two ways to show REER: (1) a rise in REER means real appreciation (loss of competitiveness) and (2) a rise in REER means real depreciation (gain in competitiveness). Organizations and economists have not decided on which way is more appropriate, so you must check each time.
You can also use fancier methods, for instance using moving weights (each year you calculate with new country weights with most recent trade data). A few years ago I received a REER spread sheet from the Bank of Mongolia, where they featured this method. But if you revise trade weights too often, they are subject to random trade shocks and special factors. Using the average of a number of years may give you a more stable REER index.
Some people say that pre-crisis exchange rate management in East Asia (up to June 1997) was a rigid dollar peg. They are not quite right. It is important to distinguish the short term (daily management) and the long term (a year or longer).
Short-term exchange rate management was clearly dollar-based. Some countries adopted very rigid dollar parities while others "floated" with some flexibility. But in either case, the US dollar was the target currency. Daily currency management was conducted in such a way that the relationship against the dollar was most stable.
Long-term exchange rate management was more varied. Some countries maintained absolute stability vis-à-vis the dollar, but most others adjusted their position more flexibly over time. More precisely, their situations from January 1990 to June 1997 (pre-crisis period) can be summarized as follows:
--Fixed with virtually no change: Hong Kong, Thailand
--Adjustable peg with occasional big change(s): China, Vietnam
--Crawling peg: Indonesia
--More flexible "managed float": Singapore, Taiwan, Korea, Malaysia, PhilippinesThis classification is based on actual movements, not official statements. Sometimes, the government says one thing but conducts exchange rate policy in another way. Thailand claimed that it had a multiple currency basket, but the Thai baht was actually fixed against the dollar. China said it had a managed float, but their management was actually an adjustable peg with very infrequent changes. Korea had the "market average rate system" which is a sort of managed float.
One way to check the short-term exchange rate policy is by way of the Frankel-Wei type regression. The two economists run a regression like this:
(Daily change in baht) = a * (daily change in USD) + b * (daily change in YEN) + c * (daily change in ECU or EURO) + ...
These daily changes are measured against an unrelated third currency such as the Swiss franc or SDR. They run this regression for every month and every currency in East Asia. The coefficient "a" is considered the weight on USD and the coefficient "b" is the weight on YEN. For Asian currencies, all other currencies (including ecu (before 1999) or euro (after 1999)) had very little influence.
Up to June 1997, the short-term management of all East Asian currencies (Singapore, Hong Kong, Taiwan, Korea, Malaysia, Thailand, Indonesia, Philippines, China, Vietnam) was dollar-based. The coefficient "a" was very close to 1, and the coefficients on all other currencies were very close to zero. For some currencies, the coefficient "b" on YEN had a small but positive impact. But overall, the US dollar was dominant.
Frankel-Wei Regression on Daily Exchange Rate Movement
Note: These graphs show the results of monthly regression from 1980 to 1997. The higher line is the coefficient on USD ("a") and the lower line is the coefficient on YEN ("b").
The pre-crisis currency management in East Asia can be summarized as follows: they were very stable against the dollar on a daily basis, but they were more flexible in the long run. In this sense, developing East Asia was (and still is) a soft dollar zone.
Were the East Asian currencies overvalued before the Asian crisis, as some argue? Using CPI and the methodology discussed above, REERs have been calculated. Our results contradict such a claim. The pre-crisis currency management was actually not so bad (See reading C for details).
We detect no acute overvaluation in Taiwan, Korea, Malaysia, Thailand, and Indonesia. Note that the three underlined countries are the ones most severely hit by the Asian crisis with the IMF programs.
On the other hand, the following countries exhibited appreciating trends during the pre-crisis period: Vietnam, Hong Kong, Philippines, China, and Singapore. These were precisely the countries whose crisis impact was less severe than the above three. So it is very difficult to argue that the countries with greater overvaluation were hit more severely by the crisis. In fact, the situation was quite the opposite.
We may safely conclude that the large depreciations associated with the Asian crisis were not the correction of the previously overvalued exchange rates. The magnitude of the fall cannot be justified by the competitiveness criterion. At most, the pre-crisis overvaluations (if any) of the three most severely hit countries (Thailand, Korea, Indonesia) were 10-15%, and perhaps less. The Korean won was actually undervalued immediately before the attack. The collapse of these currencies was on the order of 40-70%. This was clearly excessive. Their exports became too cheap during the crisis.
Real Effective Exchange Rate: Korea
Is this conclusion sensitive to the type of price index used? In lecture 5, the Balassa-Samuelson effect was introduced. It was contended that a rapidly developing country may experience a systematic gap between tradable inflation and nontradable inflation due to the productivity growth differential between these two sectors. If WPI contains more tradables and CPI is dominated by nontradables such as local food and services (which is true in Japan but may not be true in other countries), this means CPI inflation is higher than WPI inflation. This may produce a gap between CPI-based REER and WPI-based REER (CPI-based REER is more popular because CPI is more readily available than WPI in most countries).
So we recalculated REERs using WPI (with a smaller number of trading partners due to data limitation). But the overall results were not affected very much.
At any rate, the existence of the Balassa-Samuelson effect per se does not cause a bias in REER calculation. If all countries had the same amount of the Balassa-Samuelson effect, REER calculation would not be affected. It is the difference in the degree of the Balassa-Samuelson effect that causes a bias.
In the assigned paper C, we further conduct counterfactual simulations of Asian currencies. We will examine what would have happened if the Asian currencies had been managed differently before the crisis. Would an adoption of multiple currency baskets (containing dollar, yen, ecu) have improved the situation, that is, avoided overvaluation in the long run and volatility in the short run?
We have already seen that pre-crisis overvaluation was not the true cause of the Asian crisis; overvalued currencies were not attacked, but currencies without overvaluation were severely attacked. (But we must admit that sometimes the perception, not the reality, of overvaluation drives the market. Even if the baht, won and rupiah are not overvalued by the REER criterion, speculative attacks may occur if the traders believe that they are. Recall herding and information cascading in the previous lecture.)
We first check the trade weights of East Asian countries. One important feature is that the share of intra-regional trade (trade within East Asia) is increasing. The ratio was about 26% in 1980 but rose to over 40% in 1996. Another point to be noted is that Japan, US and EU are about equally important as trading partners of East Asia. This is true for the entire region as well as for virtually all individual countries (Vietnam traded relatively little with the US because it did not have a bilateral trade agreement with the US until 2001). This suggests the possibility that, if East Asian countries want to adopt multiple currency baskets, their weights with respect to dollar, yen and ecu (now euro) would be about equal.
For the ten countries mentioned above, we create hypothetical currency baskets consisting of dollar, yen and ecu. We assume that pre-crisis exchange rate management was based on these multiple currency baskets and calculate the REERs of individual currencies accordingly. We use historical (actual) price data in these simulations. To be more consistent, we should use different price paths for different exchange rate developments because of the pass-through effect. However, in practice, the required revisions in price data may be rather small. Whether with actual or hypothetical exchange rate management, these countries would have experienced no big overvaluation or undervaluation during this period.
The graph below shows the REER variability each country would have had in the pre-crisis period with or without such currency baskets.
Our first result is that, even if the East Asian countries had adopted multiple currency baskets, whether with regionally common weights or individually selected weights, that alone would not have reduced the short-term REER volatility significantly (measured in monthly standard deviation). In fact, for Korea, Thailand, Philippines, Indonesia, China and Vietnam, adoption of such baskets would have destabilized their short-term competitiveness, sometimes very greatly.
How could this happen? The reason is that these baskets do not take account of international inflation gaps. The countries mentioned immediately above were those whose inflation was higher than the global norm during the pre-crisis period. In reality, they adjusted for this inflation gap by various methods (managed float, adjustable peg, crawling peg, etc) so overvaluation did not accumulate. But the currency baskets used in the simulations are "nominal" ones which do not adjust for this. Therefore, overvaluation may become severe.
Based on this result, we next try inflation slide. This means that, in addition to the use of currency basket, each currency is automatically adjusted every month for the inflation gap between home and abroad. Two alternative methods are used: 100% inflation slide and 50% inflation slide. In the latter case, only half of the inflation gap is adjusted. Simulation results show that this has a very powerful effect in damping the REER volatility. All countries would have virtual REER stability with 100% inflation slide, and much reduced REER volatility even with 50% inflation slide (except Korea, China and Vietnam).
This means that, for the purpose of avoiding overvaluation, promptly adjusting for the inflation gap is much more important than adopting the currency basket. And inflation gap adjustment can be conducted even under the dollar-based regime (perhaps even easier that way). But we must also note that 100% inflation slide means a full accommodation of inflation shocks, which may lead to an acceleration of inflation. In this case, there is a trade-off between maintaining competitiveness and keeping inflation down.
Other important disturbances to the currency market are real shocks (business cycles, Chinese emergence, consumers' taste changes, technical innovation, etc). For this kind of shocks, too, the multiple currency basket is of no use. The monetary authority must adjust the exchange rate manually against these shocks. In other words, the multiple currency basket adjusts for only a small part of disturbances to the domestic currency (i.e., nominal changes in major exchange rates). For all other shocks, adjustments must be done manually.
|
Adjustment to: |
Dollar peg | Inflation slide | Currency basket | Basket + inflation slide |
| Fluctuations of USD, yen, euro | Manual | Manual | Auto | Auto |
| International inflation gap | Manual | Auto | Manual | Auto |
| Real shocks | Manual | Manual | Manual | Manual |
| Currency crisis | Manual | Manual | Manual | Manual |
Another question asked in the assigned paper is: whether a joint (regional) shift to currency baskets is easier than sequential shifts to that regime by individual countries--because the former arrangement overcomes the coordination problem. The result is: it does not matter very much. The coordination problem is an interesting theoretical point, but it does not really matter empirically. Whether you adjust for inflation gaps or not still is the key to stabilizing the competitiveness of their currencies.
Note that these conclusions are obtained by looking at short-term volatility in REER only. In actual currency management, prevention of long- and medium-term misalignments is perhaps more important than short-term smoothing.
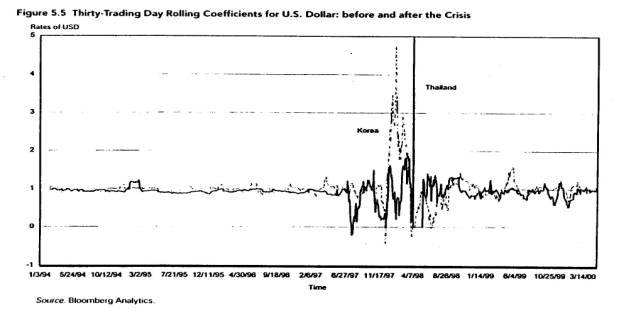
As mentioned at the outset, the East Asian currencies returned to the soft dollar zone after the Asian crisis. Their present currency management is dollar-based again. This can be very visibly demonstrated by the results of the Frankel-Wei type regression as shown below (courtesy of Ronald McKinnon). The graph shows the dollar weight ("a") of the Korean won and the Thai baht before, during, and after the Asian crisis. Both currencies returned to short-term dollar peg after the crisis.
Why did they return to the dollar? If you rule out the possibility that the central bankers in East Asia are collectively mad, the following alternative explanations can be offered: soft dollar peg--i.e., short-term stability and long-term flexibility against the dollar--is the most comfortable and convenient currency management for them, because
--Most of their trade is invoiced in USD; the use of USD in trade is much larger than their trade share with USA because many other countries, including East Asian neighbors, use USD.--FDI and financial transactions are also dominated by USD.
--In global finance, USD offers the greatest convenience in borrowing, lending and asset/debt management.
--Managing the exchange rate against one currency is technically much simpler and more transparent for both the government and the private sector.
--For countries with undeveloped forward/swap/option currency markets, short-term stability against USD protects goods and financial traders (they don't have to hedge, at least in the short run).
Even though the "short-term stability and long-term flexibility against the dollar" offers the best policy choice for East Asia, it is still subject to many shocks and problems. One of the greatest problems for East Asia is the continued fluctuation of the yen-dollar exchange rate, the two major currencies that influence the developing countries in East Asia.
When the yen appreciates against the dollar, East Asian currencies depreciate together with the dollar. When the yen depreciates, the opposite happens. But it is not a good idea to follow the yen either; in that case, their currencies become unstable against the dollar. They can stay in the middle and partly offset the impact of major currency fluctuations, but they cannot eliminate it completely. Note that there is no fundamental solution to this problem unless the yen-dollar rate is stabilized.
There are several channels through which the impact of yen-dollar rate fluctuation is transmitted to the rest of East Asia.
(1) Competitiveness: if you are competing with Japan in the global market, yen appreciation means that Japan loses competitiveness against you, and vice versa. This effect is stronger in countries with high income and technology (Korea, Taiwan).(2) Imported inflation: Japan is a major supplier of machines and parts in East Asia. If the yen appreciates, intermediate inputs from Japan become more expensive, which may cause domestic inflation or higher production costs. (This effect may be ameliorated if products from Korea, Taiwan, EU, US etc. can be substituted for Japanese).
(3) Japanese FDI: if the yen appreciates, Japanese manufacturing industries lose competitiveness. They often increase FDI to the rest of East Asia to keep the cost low. This means that a high yen is associated with a wave of Japanese FDI to the rest of East Asia, which accelerates industrialization of host countries.
(4) Yen-loan debt burden: while very few commercial loans are in yen, developing countries in East Asia have huge stocks of yen-denominated public debt associated with Japanese ODA loans (JBIC yen loans). If the yen appreciates, the debt burden in local currency (as well as in USD) will go up.
Each country is impacted differently, depending largely on their income levels and the degree of competition with Japan. Generally speaking, if the country is already highly industrialized, the first effect is most prominent (Korea's growth tends to accelerate when the yen appreciates). If the country is a big receiver of Japanese FDI and ODA, the other effects will dominate.
The other big economy in East Asia is China. What happens to the Chinese renminbi (RMB, or yuan) also affects the rest of East Asia significantly. From January 1994 to July 2005, China managed to virtually fix RMB against the dollar (as with the Hong Kong dollar) despite the Asian crisis and foreign pressure. In July 2005, China introduced a more flexible system in which RMB is allowed to float within a narrow margin--but the details of this system are ambiguous and actual exchange rate flexibility has been low up to now.
By this reform, China has at least begun to move toward a more flexible exchange rate system. At present, there is no great speculative attack on RMB, although there is a political accusation (by US, in particular) that RMB is undervalued. Even though the market is relatively calm today, there may be a time when instability increases in the future. From the long-term perspective, China should continue to move, step by step, to a more flexible exchange rate system with freer and more open capital markets. But rapid liberalization should be avoided.
Like the case of the Japanese yen, the movement of RMB will affect different neighboring countries differently. At present, the major channel of impact is through the change in relative competitiveness. If your country is complementary to China in the global market (i.e., your exports and China's exports are very different), RMB's movement does not affect your competitiveness directly. This is the case with high-income countries like Japan and Korea. But if RMB depreciates, Chinese exports become more competitive and Japan may invest more in China to produce there, so that will accelerate de-industrialization (or "hollowing-out") of Japan. RMB appreciation will have the opposite effect.
But if you directly compete with China in the global market, the impact of RMB depreciation will be more direct and severe. This is the case with most of the ASEAN countries (except Singapore and Brunei). If Chinese goods become low-cost, such countries will lose in three ways:
--Loss of competitiveness in the global market
--Intrusion of Chinese goods into your country
--Loss of FDI to China
Even without RMB depreciation, these are already happening in the ASEAN countries with the recent emergence of China as the factory of the world.
If China adopts a more flexible exchange rate regime, will (should) RMB appreciate or depreciate? Those worried about the recent Chinese industrial strength expect RMB appreciation (so Chinese exports will be less competitive). China's huge and continuing current account surplus also suggests the possibility of appreciation. But if some Chinese industries and agriculture get into serious trouble because of WTO and more open foreign competition, these industries may want a depreciation.
When the exchange rate becomes more flexible, it is sometimes very difficult to predict which way the market goes (when the euro was created, very few people could predict its movement--it depreciated greatly against the dollar, and now it has appreciated significantly). It all depends on the market sentiment (currency traders are not always rational). Remember also that the Chinese capital account is still very much regulated. So the currency movement will not be so free after all, and the Chinese government must continue to intervene to "make the market" for a considerable time to come.
Another point to consider is that, in goods market integration, China is relatively an open economy despite its huge size. Its trade (exports + imports) to GDP ratio is close to 50%. Most of the manufactured exports are produced with foreign parts (which are invoiced in USD), so RMB depreciation may not affect their competitiveness so much. This indicates that China's pass-through coefficient, as far as electronics parts and high-tech machines are concerned, may be quite high.
<References>
Kawai, Masahiro, and Taizo Motonishi, "Is East Asia an Optimum Currency Area?" in Masahiro Kawai, ed, Financial Interdependence and Exchange Rate Regimes in East Asia, Policy Research Institute, Ministry of Finance, Japan, 2004 (pp.157-203). paper
Kwan, Chi Hung, Yen Bloc: Toward Economic Integration in Asia, Brookings Institution Press, 2001.
Ohno, Kenichi, "Exchange Rate Management in Developing Asia: Reassessment of the Pre-crisis Soft Dollar Zone," ADB Institute Working Paper no.1, January 1999.
Real effective exchange rate calculation for Vietnam (sample Excel sheet). This is not an official calculation.
Vietnam's exchange rate management (PPT presentation).